


The Spiral Path view displays the bare structural framework of Moran's Periodic Spiral — the arrangement of all 118 elements along a continuous, unbroken curve. Unlike the traditional periodic table, which introduces visual gaps to preserve column alignment, the spiral makes the seamless progression from hydrogen to oganesson immediately apparent. This view is the ideal starting point for understanding how the spiral works before any data is layered onto it.

Density — how much mass is packed into a given volume — varies dramatically across the elements, and the spiral makes those contrasts vivid. Lightweight elements like lithium cluster near one end of the spectrum, while dense transition metals like osmium and iridium (the densest naturally occurring elements) stand out clearly. The spiral format lets you see at a glance how density shifts as atomic number increases, and where the heavy concentrations literally and figuratively lie.

Atomic weight is the average mass of an element's atoms, accounting for the natural mix of its isotopes (variants of the same element with different numbers of neutrons). This view maps those weights across all elements, revealing a generally steady increase as you move outward along the spiral — with a few notable irregularities that have fascinated chemists since Mendeleev first noticed them in the 19th century.
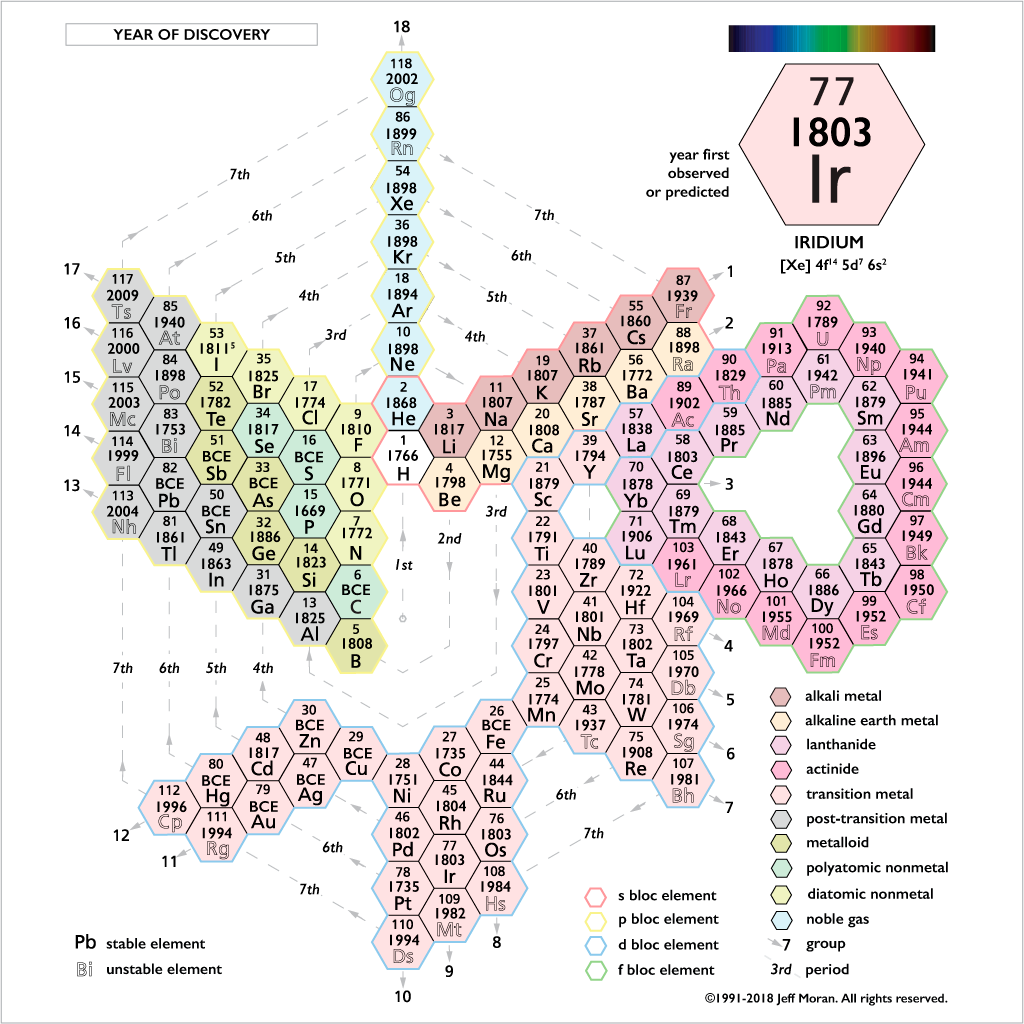
This view tells the human story of chemistry. Elements known since antiquity — gold, copper, sulfur — occupy one end of the timeline, while synthetic elements created in particle accelerators within the last few decades occupy the other. Mapped onto the spiral, the chronology of discovery becomes a history of scientific progress: from ancient observation, through the golden age of 18th- and 19th-century chemistry, to the modern era of nuclear physics.

Of the 118 known elements, only a handful make up the overwhelming bulk of Earth's crust. Oxygen and silicon dominate; most of the rest exist in trace amounts or not at all in nature. This view makes those stark contrasts visible, helping explain why some elements are cheap and ubiquitous while others are rare and precious. It also offers a useful reminder that the periodic table is a map of possibility, not of equal availability.

In their pure, elemental form, most substances have a characteristic color — though many are surprising. This view displays the actual colors of the elements as they appear in their standard state (solid, liquid, or gas at room temperature), from the silvery gleam of most metals to the vivid yellows, reds, and greens of various nonmetals and halogens. It's one of the most visually striking versions of the spiral, and a reminder that chemistry is as much a sensory science as an abstract one.

Electronic configuration describes how electrons are arranged in shells around an atom's nucleus — and it is the single most important factor in determining how an element behaves chemically. This view maps those configurations across the spiral, making it easier to see the repeating patterns (the “periodicity”) that give the periodic table its name and its power. The spiral geometry is particularly well suited to this view, since it naturally reflects the way electron shells fill in successive layers.

The boiling point of an element is the temperature at which it transitions from liquid to gas. These values range from near absolute zero (helium boils at −269°C) to several thousand degrees (tungsten, the highest, boils at over 5,500°C). Plotted on the spiral, boiling points reveal clear trends within element families and highlight the outliers — elements whose behavior defies simple expectations.

This view serves as a navigational reference, labeling each position on the spiral with the element's full name rather than its symbol. It's particularly useful for those still building familiarity with the elements, and for educators introducing the spiral as a teaching tool. Seeing the names laid out along the continuous curve also reinforces one of the spiral's central arguments: that the elements form a single, unbroken family, not a collection of disconnected groups.
.png)
Electronegativity measures an atom's tendency to attract electrons toward itself when bonded to another atom — a concept central to understanding why molecules form the way they do. Elements with high electronegativity (like fluorine, the highest of all) pull electrons strongly; those with low electronegativity (like the alkali metals) give them up readily. This view maps those values across the spiral, making the periodic trends in electron-attracting power immediately visible.

Melting points — the temperatures at which a solid becomes a liquid — span an extraordinary range across the elements. Helium, under normal pressure, never solidifies at all; tungsten requires nearly 3,400°C. This view plots that full range on the spiral, illuminating how melting behavior tracks with atomic structure and element family, and where the most dramatic transitions occur.

Specific heat capacity is the amount of energy required to raise the temperature of a given mass of a substance by one degree. Elements with high specific heat capacity absorb a lot of heat before warming up — water's unusually high value, for instance, is why oceans moderate climate. This view maps specific heat across the elements, revealing patterns that connect to atomic mass and bonding behavior, and pointing toward some chemically important outliers.

At room temperature and standard pressure, elements exist as solids, liquids, or gases — and a handful are synthetic elements that don't exist long enough to observe directly. This view color-codes those states across the spiral, offering an immediate visual answer to the question: which elements are metals you could hold, which are gases you breathe, and which are the two liquids (mercury and bromine) that stand apart from the rest?